Portfolio Update 5th Sep 2016

Hello folks! It have been awhile since I last updated in this space, to be exact, 9 months.

Lots of things have happened to me in the last 9 months. I mean 2016 started badly for me. I was in a car accident in January and i had to pay for the damages for my family’s car repair as the quoted repair cost was lower than the excess. But as the chinese saying goes, 大难不死,必有大福 which loosely translate to ” one who survive a great disaster is destined to enjoy good fortune.”

The rest of the year indeed went on smoothly for me. I received a promotion at work and even went to U.S. for a business trip. That was actually the first time I had travel to any country out of Asia.

At the moment i am just holding on to 2 counters. STI ETF (ES3) and Frasers Centrepoint Ltd (TQ5).

Counter Shares % of Portfolio Avg. Price
STI ETF 1901 64.37% 2.86
Frasers Centrepoint Ltd. 2000 35.63% 1.52

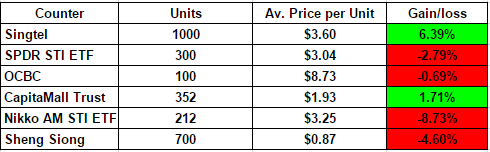
Over the course of these 9 months, I have made many buy and sell transactions.

  • ARA (D1R) – 7.03% Profit
  • Capitamall Trust (C38U) – 9.60% Profit
  • DBS (D05) – 3.39% Profit
  • Singtel (Z74) – 1.10% Profit
  • Sheng Siong (OV8) – 2.92% Profit
  • OCBC (O39) – 1.49% Loss
  • Nikko AM STI ETF – 6.63% Loss 

The reason for these transaction is mainly due to SCB’s implementation of minimum commission. This forces me to offset some of my smaller holdings.

My core portfolio will mainly be index funds from now on with a mixture of individual stocks for shorter term investments.

Targets

  • Accumulate STI ETF at 2.80
  • Accumulate Singtel at 3.60
  • Start DCA ABF Singapore Bond Index A35.


Portfolio Update (1st Dec 2015)

Since my last blog post in late October, I have made some additions to my portfolio.

Added OCBC.

Added SPDR STI ETF.

Added CapitaMall trust.

Added Sheng Siong.

Receive dividends from CapitaMall Trust at 2.98cents per share.

My portfolio is still very small. 4 digit portfolio.

Currently, my portfolio stands at a positive 1.66% , mainly due to Singtel as it has the heaviest weightage in my portfolio.

1


Mistakes of a novice investor

Even though I have only started investing in May this year, I realized that I have made many amateur mistakes. Despite reading up so much from other financial bloggers, I thought to myself, I would never make such mistakes. I still failed to avoid making such mistakes.

It may not be mistakes yet, but it is definitely a bad habit for a investor.

I shall share with you guys some mistakes that I have made as a novice investor.

Not researching enough

When I first read up about Maybank KE’s Monthly investment plan (MIP), I was stoked! 1%  commission for contract value less than $1000! WA I can invest in blue chips companies some more, confirm better than POSB Invest Savers!

I went on to create my Maybank KE account and proceed to enrol in the MIP. It was after the 2nd month that I realised that although it is indeed 1% commission charged when purchasing the shares. BUT, when you want to sell it off, there is a $18.00 minimum commission. 

Lesson learnt. I have stopped my MIP with them, since I have my SCB account with no minimum charges.

sad-man
Ok. I am exaggerating. But you get the idea.

Chasing the market

Thinking that the market is recovering, I continue to buy more shares at a higher price, fearing that I may not capitalize and ride with the wave. Now, when the market is down, I am left with limited funds. And with limited funds, I am only left with the option of averaging down and missed out the opportunity of holding other companies that I am targeting.

In this case, I realized that I have unknowingly forced myself to pump more money that I would like to into the market, just to average down my cost.

Lesson learnt. Now I am sticking to this strategy whereby I will only buy more if it is below my entry price. For new counters, I will need to do more of point 1, which is to research more before committing.

man-chasing-money

Being too affected by short term market trends

As a long term investor, there is no need to keep monitoring the market. However, I kept checking my phone to check on my watchlist and portfolio market value. I really need to stop doing that. Any one out there have a good advice? Other than deleting the app all together? HAH!

On a positive note, at least I realized my mistakes and made these mistakes when I am still fairly new to the scene.

How did chilli crab perform on its first day?

1

Jumbo Group Limited (42R) opened at 0.35 and started off strongly, with share price rising to a day high of 0.395 within the first few minutes of market opening and started to stabilized at around 3.55 – 3.6~ before slowly moving down and ended its first day of trading closing at a price of 0.34.

2

Despite the hype during the IPO, where its shares are oversubscribed by 8 times, Jumbo did not perform as well as most people would expect. My sentiments is that most people in general are not that confident and are looking to enter early into the market and to flip profit within the first day. Once it hits its first resistance at 0.395, they start to fall gradually.

Initially, I also wanted to purchase a bit of 42R just to get into the action. It is my first time experiencing an IPO and it is also a household brand that is close to every Singaporean’s heart. However, I was busy at work early in the day and I am glad that I did not try to chase after the price surged.

Although It is still very early to comment on anything. I still feel that it could still be a multi-bagger for investors looking to hold it long term. But for me, F&B businesses just isn’t my cup of tea. Just my 2 cents.

Don’t Rush!!

Just last week, STI Index was trying to break the resistance of 3,100. And as of 3rd November 2015, the index has fallen back to a closing price of 2,999.56.

However, as a long term investor, I am not too concern with the volatility. As prices of stock falls, the market presents me with an opportunity to enter at a “discounted” rate.

The unfortunate thing is that I am quickly running out of ammunition.

allocation

Although I am only about 30% vested, but my emergency fund holds a substantial % of my cash holding. Good thing is that I have zero short/long term liability and bonus is coming in this month end!

I believe psychology and managing your emotions plays a big part in investing. The key to victory is to remain calm and not to rush into things.

Long term investing is a journey and not a race. It is not about accumulating the most number of shares in the shortest time.

Don’t rush into the market afraid that you may lose out on an opportunity when there is a rally. Don’t rush into the market seeing that the price of a particular stock has dropped. Cheaper can only get cheaper.

I shall leave you guys with a funny picture I found while reading through this BLOG

Stock-trading-emotions
CLICK TO ENLARGE IMAGE

Where My Money Went?

How time flies….

I still vividly remember how hard it was a find a job after my last paper.

Fast forward to present day, just last month, I have just clocked one year of working experience. Ever since, I received my first pay check, I have been updating my expenses religiously through an application on my phone. And during the weekends, I will import the data over to my google sheet as a back up.

So, today i will share with you guys Where My Money Went in the last 12 months. Do note that the total sum is based on my net income and not gross income.

Tadaaaaa!

Money

Point to note for myself :

  1. My “Savings & Investments” category exceeded by target of 40% by 5%!! I will aim for 50% for the next calendar year as part of my 2016 new year resolution.
  2. I really ought to cut down on smoking as cigarettes amount to 4%. It even holds a heavier weight-age that my daily transportation fees!!
  3. I have already allocated a hefty 11% of my net income for my upcoming trip to Japan this end December. OUCH! However, I do foresee a decline in this category as my plan is to have a big trip a year then a small trip and the next year.

    Overall, I am quite contented with the allocation. Hopefully I can keep up with the discipline.

Fixed Amount Vs Fixed Units

Is buying a fixed number of units on a regular schedule or is allocating a fixed amount on a regular schedule a better strategy?

Firstly, I shall start off with the definition of dollar cost averaging.

buying fixed dollar amount of a particular investment on a regular schedule, regardless of the share price

Ok. So that is purchasing shares using a fixed amount.

What about fixed number of units? What is that called? I dont think there is a term for it. But i will just call it Share Cost Average (SCA).

For this illustration, i will use ES3 as the share to purchase. I will also make a comparison between POSB invest savers (Fixed Amount) vs standard chartered online equities trading account (Fixed Units).

Assumptions
1. Share price are based on the closing price of the 1st opening day of the SG market.
2. I will allocate 300 a month for POSB invest savers plan
3. 100 units purchased using SCB trading account
4. I will not take dividends into consideration for the gains/losses

POSB Invest Saver

Month & Date Share Price Amount Allocated Comm. Cost Total Cost Units Bought Average Price
Jan $3.41 300 $3.00 $296.67 $299.67 87 $3.44
Feb $3.41 300 $3.00 $296.67 $299.67 87 $3.44
Mar $3.39 300 $3.00 $294.93 $297.93 87 $3.42
Apr $3.44 300 $3.00 $295.84 $298.84 86 $3.47
May $3.51 300 $3.00 $294.84 $297.84 84 $3.55

SCB

Month & Date Share Price Amount Allocated Comm. Cost Total Cost Units Bought Average Price
Jan $3.41 $0.792 $341.00 $341.79 100 $3.42
Feb $3.41 $0.792 $341.00 $341.79 100 $3.42
Mar $3.39 $0.788 $339.00 $339.78 100 $3.40
Apr $3.44 $0.798 $344.00 $344.79 100 $3.45
May $3.51 $0.812 $351.00 $351.81 100 $3.52

How did each plan fared?

Plan Total Comm. Total Cost Total Units Average Price
POSB IS $15.00 $1,493.95 431 $3.47
SCB $3.98 $1,719.98 500 $3.44

Based on the average price difference of just $0.04, I wouldn’t say that any plan is better.

You may say that ” But you are buying when the share is going up what! Who will keep averaging up ?! ” True.

So now, let’s say the same criteria from June to October 2015 instead. When the price of ES3 is dropping.

POSB Invest Saver

Month & Date Share Price Amount Allocated Comm. Cost Total Cost Units Bought Average Price
Jun $3.39 300 $3.00 $294.93 $297.93 87 $3.42
Jul $3.37 300 $3.00 $296.56 $299.56 88 $3.40
Aug $3.22 300 $3.00 $296.24 $299.24 92 $3.25
Sep $2.92 300 $3.00 $294.92 $297.92 101 $2.95
Oct $2.85 300 $3.00 $296.40 $299.40 104 $2.88

SCB

Month & Date Share Price Amount Allocated Comm. Cost Total Cost Units Bought Average Price
Jun $3.39 $0.790 $339.00 $339.79 100 $3.40
Jul $3.37 $0.780 $337.00 $337.78 100 $3.38
Aug $3.22 $0.744 $322.00 322.74 100 $3.23
Sep $2.92 $0.674 $292.00 292.67 100 $2.93
Oct $2.85 $0.660 $285.00 285.66 100 $2.86

So how is it now?

Plan Total Comm. Total Cost Total Units Average Price
POSB IS $15.00 $1494.05 472 $3.18
SCB $3.65 $1578.65 500 $3.16

The differences between the average price is even closer than the previous scenerio, at $0.02.

Using these statistics, I wouldn’t say which plan is better in terms of profitability.

However, there are still pros & cons to each plan. I will try to sum up each plan using just one sentence

Fixed  Amount (DCA) – Offers you a ULTRA passive, no-hassle way of investing, however, offers no flexibility as date of purchase is not controlled by you.

Fixed Units (SCA) – Its strength is also its weakness as it due to the fact that the date of purchase is controlled by you.

Managing your portfolio is like managing a Football Club

I always have this weird thought about the different asset classes in a portfolio.

Just imagine, emergency savings, fixed deposits and insurance are like your defensive players. Equities and real estate are your offensive players. If you have too many defensive players in your team, it is unlikely you will score goals (Profits). Likewise, if you have too many offensive players, you may be vulnerable to conceding goals (Losses).

The important thing is to strike a balance, so that there will be “chemistry” in the team. (Diversified Asset Class). Building a football team or a portfolio isn’t something you can do overnight. Always find ways to strengthen your weak point. Buying a offensive player to boost your attack or buying a defensive linchpin to shore up your defense.

This is how i envision different asset class will look on a football pitch.

football 2

To sum this post up, there are times to be offensive and also a time to be defensive, it just depends on who your opponent is (Market) and the philosophy of the manager (YOU).

Investment Portfolio – 26 Oct 2015

Counter Units Average Cost Per Unit Gains/Losses
Sheng Siong 500 $0.877 0.32%
Singtel 1000 $3.60 13.06%
SDPR STI ETF 100 $3.006 4.13%
Capitamall Trust 252 $1.946 -6.38%
Nikko AM STI ETF 212 $3.254 -1.96%

My portfolio for year 2015 stands at a total gain of

9.14%

as of 26 Oct 2015. Mostly due to Singtel as it is my biggest holding, weighing approximately 62%-65% in my portfolio.

Some of you may ask why do I hold both STI ETF. Nikko AM STI ETF is bought through POSB Invest Saver and SDPR STI ETF is bought through StandChart trading account.

I am generally a very low risk tolerant person, buying into blue chips company seems like the easiest way for me.

Pilot

My investment journey started in May 2015, when I started to invest in a Nikko AM STI ETF (G3B) with POSB Invest-Saver. But as the months goes by, and as we start to enter into a bear market, I started to increase my monthly contributions to average down my cost.

Month Contributions Units Purchased Average Cost Per Unit
 May $100.00   27   $3.552
 June  $100.00  28  $3.420
 July  $100.00   29 $3.379
 August  $200.00  62  $3.180
 September  $200.00   66  $2.970

This regular saving plan (RSP) allow me to average down my cost per unit for G3B. Currently I am holding 212 units of G3B at a average cost of $3.254.

However, for the month of October, I terminated my RSP with POSB Invest-Saver as I have set up my Standard Chartered trading account and I will allocate money to purchase 100 shares of SDPR STI ETF (ES3) every month instead.